


Description
Overview
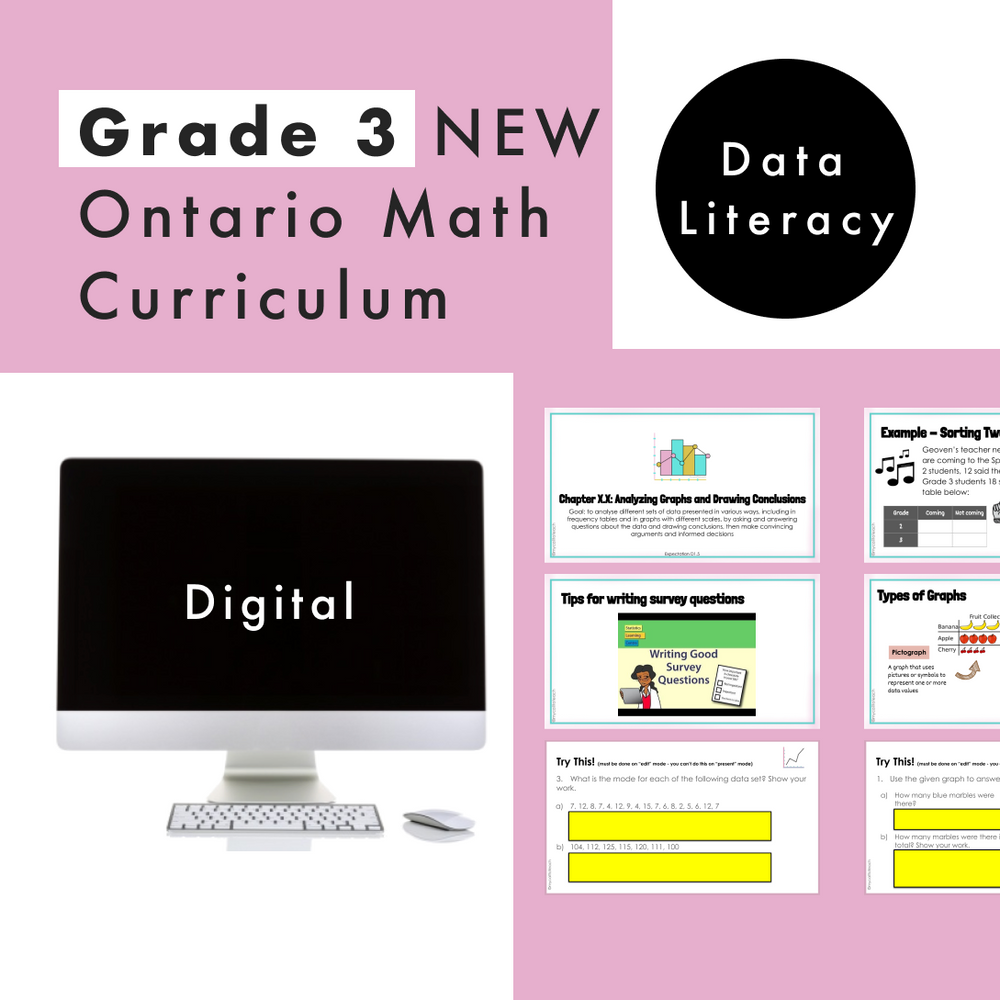
Are you planning for the NEW Grade 3 Ontario Math Curriculum? This editable Google Slide resource is what you need!
This resource is for the DATA strand and covers specific expectations for “D1. Data Literacy". In this resource, students will experience math through engaging real-life questions, storytelling through math, and interactive slides.
What’s Included:
-
6 Google Slide presentations
-
149 UNIQUE and EDITABLE Google Slides in total
-
Slides are editable for you to increase student engagement (e.g. you can add your Bitmoji, change the name in the word problem example, add pictures, etc.)
-
Interactive student slides – value-added questions to assess student understanding. Students can hand in Google Classroom when completed.
-
Each file starts off with an Opening Engagement Question touching on real-life, practical situations told in a storytelling format.
-
Specific expectations that are covered
-
Google Form Assessment
Titles of sections included:
1. Sorting Data (D1.1)
2. Collecting Data (D1.2)
3. Types of Graphs (D1.3)
4. Mean and Mode (D1.4)
5. Analyzing Graphs and Drawing Conclusions (D1.5)
6. Drawing Graphs - Culminating Project
7. Google Form Assessment
Specific Expectations covered:
D1.1 sort sets of data about people or things according to two and three attributes, using tables and logic diagrams, including Venn, Carroll, and tree diagrams, as appropriate
D1.2 collect data through observations, experiments, and interviews to answer questions of interest that focus on qualitative and quantitative data, and organize the data using frequency tables
D1.3 display sets of data, using many-to-one correspondence, in pictographs and bar graphs with proper sources, titles, and labels, and appropriate scales
D1.4 determine the mean and identify the mode(s), if any, for various data sets involving whole numbers, and explain what each of these measures indicates about the data
D1.5 analyse different sets of data presented in various ways, including in frequency tables and in graphs with different scales, by asking and answering questions about the data and drawing conclusions, then make convincing arguments and informed decisions
Are you looking for extra, supplement practice that aligns with this digital unit? Check out the Data Literacy Worksheet Package.
Are you looking for SUMMATIVE assessments for the New Ontario Curriculum? Check out this Data Literacy Assessment Package.
Total Pages
159 Google Slides, 1 Google Form
Answer Key
Included